
VAB vs ZAG: two near-identical Canadian bond ETFs
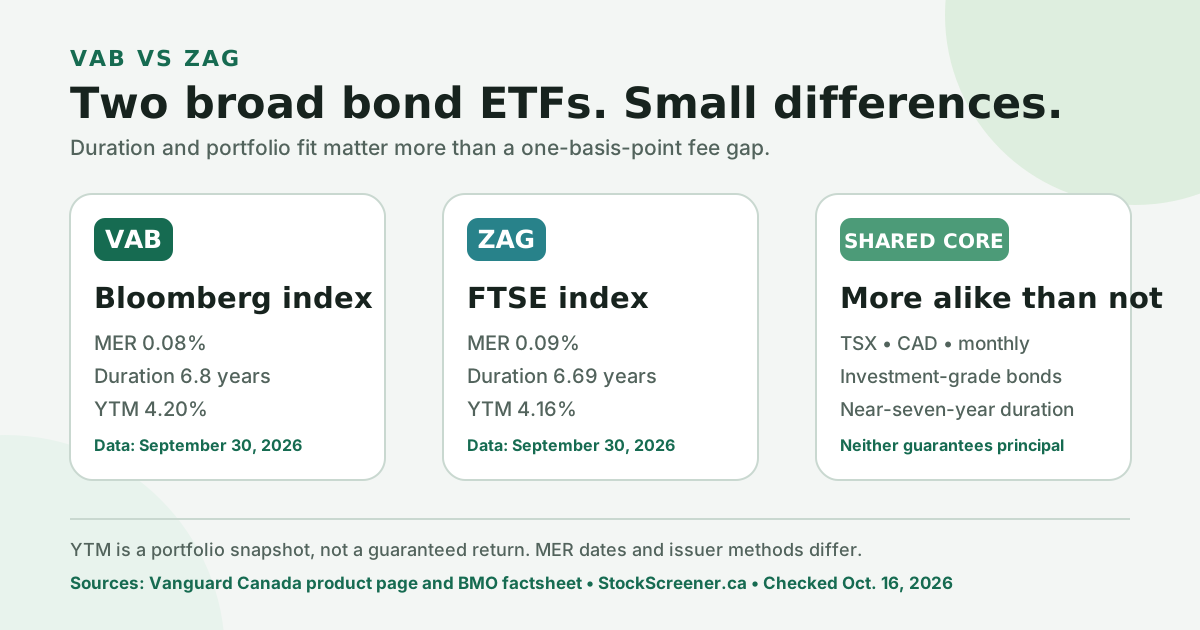
VAB and ZAG do almost the same job. Both hold broad, Canadian-dollar, investment-grade bond portfolios; both trade on the TSX; both pay monthly; and their latest published durations are close to seven years. On September 30, ZAG was larger and held 1,919 securities, while VAB reported 1,324 bonds. VAB's latest published MER is 0.08% versus 0.09% for ZAG.
None of those differences makes one fund better across the board. A 0.01-percentage-point MER gap is about $1 a year per $10,000 if the balance and ratios stayed constant, so time horizon, tolerance for bond-price swings, the live trading spread and avoiding an unnecessary taxable sale usually matter more. Both take the same kind of interest-rate risk, and the account they sit in does not change that.
Duration: how much each could move when rates change
VAB's average duration was 6.8 years on September 30. ZAG's weighted average duration was 6.69 years on the same date. The Ontario Securities Commission's investor education site explains duration as a measure of how sensitive a bond's price is to interest-rate changes.
As a rough illustration, a parallel one-percentage-point rise in market yields would imply a price decline of about 6.8% for VAB and 6.7% for ZAG before allowing for income, the passage of time, credit-spread changes, and the fact that yield curves rarely move perfectly in parallel. A one-point decline would point in the other direction. This is sensitivity arithmetic, not a forecast.
That similarity matters. Someone who needs stable principal on a known date should not treat either fund as cash or as a GIC. The funds continually buy and sell bonds as their indexes change; the ETF itself has no maturity date that returns a fixed face value to a unitholder. Both issuers label the funds low risk under the standardized Canadian scale, but both also warn that the value can fall and principal is not guaranteed.
VAB reported a 4.20% effective yield to maturity, while ZAG reported 4.16% on the same date. Those are portfolio snapshots using issuer methodologies, not distribution rates and not promised returns. The figures can change daily as prices, holdings, and yields change. The small difference may reflect portfolio composition and methodology rather than a durable advantage.
VAB and ZAG side by side
Information checked October 16, 2026. Portfolio figures for both funds are dated September 30. VAB figures are from Vanguard's live product page, supplemented by its August 31 factsheet; ZAG figures are from BMO's September 30 factsheet. ZAG's MER is its latest audited ratio. Vanguard's July ETF Facts reports a 0.09% MER for the year ended December 31, 2025, while its newer August factsheet and live page report 0.08% as of June 30, 2026; this comparison uses the newer period.
| Factor | VAB | ZAG | Practical read |
|---|---|---|---|
| Full name | Vanguard Canadian Aggregate Bond Index ETF | BMO Aggregate Bond Index ETF | Both target the broad Canadian investment-grade bond market |
| Benchmark | Bloomberg Global Aggregate Canadian Float Adjusted Bond Index | FTSE Canada Universe Bond Index | Different rulebooks, very similar job |
| Management fee / MER | 0.08% / 0.08% | 0.08% / 0.09% | About $1 per $10,000 separates the latest MERs |
| Portfolio count | 1,324 bonds | 1,919 securities | Both are highly diversified; issuer terminology differs |
| Effective yield to maturity | 4.20% | 4.16% | Snapshot estimates, not promised investor returns |
| Duration | 6.8 years | 6.69 years | Nearly the same sensitivity to rate changes |
| Net assets | $7.57 billion | $12.92 billion | Both are established, multi-billion-dollar funds |
| Distributions | Monthly | Monthly | Frequency does not determine total return or tax character |
| Trading | TSX, Canadian dollars | TSX, Canadian dollars | No USD conversion is required for either |
Sources and dates: Vanguard Canada's product page, with portfolio data dated September 30, 2026, and BMO's September 30, 2026 factsheet. Yield to maturity is before future fund expenses and does not lock in an ETF investor's return. Net assets, portfolio composition, yields, and trading costs change.
Two indexes, slightly different portfolios
VAB tracks the Bloomberg Global Aggregate Canadian Float Adjusted Bond Index and uses an index-sampling strategy. Vanguard says its benchmark includes investment-grade government, government-related, and corporate securities issued in Canada with maturities longer than one year. Bloomberg's methodology says the Canadian float adjustment reduces amounts outstanding for specified Bank of Canada holdings instead of weighting every eligible dollar equally.
ZAG tracks the FTSE Canada Universe Bond Index. BMO says that index includes Canadian-dollar, fixed-rate federal, Crown corporation, provincial, and corporate bonds with terms longer than one year and ratings of BBB or higher. Securities are weighted by relative market capitalization and the index is rebalanced daily.
Because the indexes differ and VAB samples its benchmark rather than holding every constituent, the portfolio counts differ too. A higher count does not make ZAG safer or more usefully diversified: both spread exposure across well over a thousand securities and many government and corporate issuers.
There is no currency decision between them. Both trade in Canadian dollars and mainly hold Canadian-dollar bonds, unlike a choice between Canadian-listed and US-listed equity ETFs, where conversion costs and withholding layers can dominate.
Credit quality: both investment grade
VAB's September 30 credit mix was 45.14% AAA, 33.84% AA, 12.17% A, and 8.86% BBB. ZAG's September 30 mix was 45.34% AAA, 28.28% AA, 16.02% A, and 10.37% BBB. Rounding and issuer classification methods apply.
Both therefore had about 45% in the highest displayed rating bucket and no below-investment-grade allocation in the published breakdown. ZAG had somewhat more A and BBB exposure, while VAB had more AA exposure. Yet VAB's reported yield to maturity was marginally higher on the same date, a reminder that rating mix alone does not determine portfolio yield and issuer methodologies can differ.
Issuer sector labels are less directly comparable. Vanguard separated Treasury/federal, provincials/municipals, agencies, financial institutions, industrials, utilities, and supranationals. BMO grouped holdings into federal, provincial, corporate, municipal, and other buckets. A larger-looking “federal” or “corporate” slice may partly reflect classification, not a dramatic portfolio bet.
Monthly payments are not the same as return
Both distribute monthly, which should not drive the choice. Total return combines cash distributions with changes in unit price: a fund can pay a distribution and still lose money if its bonds fall enough, or earn more than its payout when bond prices rise.
BMO reported a 3.43% annualized distribution yield for ZAG on September 30. Vanguard's product page reported a 3.48% 12-month trailing yield for VAB on the same date. These labels use different look-back or annualization methods, so the two numbers are not a clean ranking. Neither equals yield to maturity, and neither is guaranteed.
Tax character is another reason not to equate the cash payment with “interest.” CRA says a Canadian mutual fund distribution can contain interest, capital gains, dividends, foreign income, return of capital, or a combination. In a taxable account, use the T3 slip and fund tax information rather than guessing from the portfolio or payment amount. Reinvested distributions still require reporting, and return of capital changes adjusted cost base. The site's ETF distributions and adjusted cost base guide explains the bookkeeping.
Accounts: the same mechanics for both
| Account | Tax treatment in broad terms | What matters for VAB versus ZAG |
|---|---|---|
| TFSA | Investment income and gains are generally tax-free, including on withdrawal | No structural winner; compare risk, spread, and implementation |
| RRSP / RRIF | Growth is tax-deferred; withdrawals are generally taxable | The fund choice does not change the account's basic tax deferral |
| FHSA | Qualifying withdrawals are tax-free; the home-buying date constrains risk | Time horizon may matter more than the ticker |
| RESP | Tax is deferred; grants and growth are generally taxable to the beneficiary when paid as EAPs | Education timing and planned withdrawals matter more than the issuer |
| Taxable | Distributions and realized gains or losses must be reported according to their character | Use tax slips, track ACB, and avoid a needless taxable switch |
A registered account can shelter current distributions from annual tax, but that does not automatically mean all bonds belong there. Registered room is limited, expected returns differ across assets, RRSP withdrawals are taxable, and personal tax rates change the trade-off. Decide account location across the whole portfolio rather than assigning an account from the ticker alone.
For a TFSA, CRA says income and capital gains are generally tax-free even when withdrawn. For an FHSA, the investment horizon before a home purchase is crucial: a seven-year-duration bond ETF can fall over a short period. The same timeline logic applies as an RESP approaches planned withdrawals. Neither VAB nor ZAG becomes principal-guaranteed because it sits in a registered account.
A checklist for bond ETF buyers
- Confirm that aggregate bonds fit the job. Both funds take meaningful interest-rate risk. Cash, a short-term bond fund, a GIC ladder, and a broad aggregate bond fund solve different problems.
- Treat the fee gap in dollars. The latest 0.01-point MER difference is about $1 per $10,000 annually if all else stayed equal. One unfavourable execution, commission, or avoidable tax event can exceed it.
- Compare live trading conditions. Check the bid, ask, spread, commission, and brokerage availability when trading. Net assets alone do not tell you the execution price.
- Choose an index only if its differences matter to you. ZAG's FTSE benchmark and VAB's Bloomberg float-adjusted benchmark produce modest differences in counts, ratings, and weights. They do not change the basic portfolio role.
- Respect an existing taxable position. Selling one fund to save roughly one basis point can realize a gain or loss. If harvesting a loss, do not assume the other ETF is automatically safe from the superficial loss rule; “identical property” is a fact-specific tax question.
- Check for duplicated bonds. Asset-allocation ETFs already contain fixed income. The VBAL versus XBAL comparison and VBAL versus VGRO guide show how bond sleeves are built into one-ticket portfolios.
The honest conclusion is unexciting: VAB and ZAG are close substitutes for broad Canadian investment-grade bond exposure. VAB publishes the slightly lower MER; ZAG is larger and reports more securities, while VAB had a slightly higher yield to maturity on the shared September 30 measurement date. Duration, credit quality and account mechanics are close enough that implementation and portfolio fit should outweigh any claim of a permanent winner.
Related reading
- VBAL vs XBAL: balanced portfolios and their bond building blocks
- VBAL vs VGRO: how much fixed income?
- XBAL vs XGRO: 60/40 or 80/20?
- FHSA investments and the home-buying timeline
- ETF distributions and adjusted cost base in Canada
- Canada's superficial loss rule and the 61-day window
Look up VAB or ZAG
The screener shows an educational account-location read for either fund. Check current documents, spreads and tax treatment before relying on it.
Search VAB in the screenerFrequently asked questions
How much could VAB or ZAG fall if interest rates rise?
As rough sensitivity arithmetic, a parallel one-percentage-point rise in market yields would imply a price decline of about 6.8% for VAB and 6.7% for ZAG, based on their September 30 durations of 6.8 and 6.69 years. Income, time, credit spreads and uneven yield-curve moves change the actual result, and this is not a forecast.
Are VAB and ZAG safe like cash or a GIC?
No. Both hold high-quality bonds, but their unit prices change as interest rates, credit spreads, and market conditions change. Neither guarantees principal or has a maturity date at which an ETF investor receives a fixed face value.
Why can a bond ETF lose money when it pays interest?
A bond ETF's total return combines distributions with changes in unit value. When market yields rise, existing bond prices generally fall. With duration near seven years, VAB and ZAG can have meaningful price movement even while continuing to pay monthly distributions.
Do bond ETFs like VAB and ZAG belong in a registered account?
Not automatically. A TFSA or RRSP shelters interest and other distributions from annual tax, but registered room is limited, expected returns differ across assets, RRSP withdrawals are taxable, and personal tax rates change the trade-off. Decide account location across the whole portfolio, not from the ticker alone.
Sources
- Vanguard Canada, VAB product page, objective, strategy, current fee and MER, assets, monthly distribution schedule, benchmark, portfolio data, and 12-month yield; checked October 16, 2026.
- Vanguard Canada, VAB factsheet, August 31, 2026, including benchmark scope, portfolio count, duration, maturity, yield to maturity, credit quality, sector weights, fee, and MER date.
- Vanguard Canada, VAB ETF Facts, July 16, 2026, including the standardized low risk rating, no-guarantee warning, and the older 0.09% MER for the year ended December 31, 2025.
- Bloomberg Fixed Income Index Methodology, January 8, 2026, Canadian float adjustments to amounts outstanding.
- BMO ETFs, ZAG product page, official fund overview and document access; checked October 16, 2026.
- BMO Global Asset Management, ZAG factsheet, September 30, 2026, including benchmark rules, fees, assets, securities, duration, yield measures, credit mix, sectors, and distribution frequency.
- Ontario Securities Commission Investor Office, factors affecting bond prices, duration, interest-rate, inflation, market, and credit risk; checked October 16, 2026.
- Canada Revenue Agency, tax treatment of mutual funds, distribution character, reinvested distributions, sale of units, and adjusted cost base; checked October 16, 2026.
- Canada Revenue Agency, capital losses and superficial losses, the substituted-property timing and ownership tests; checked October 16, 2026.
- Canada Revenue Agency, archived Interpretation Bulletin IT-387R2, the fact-specific meaning of identical properties. The bulletin is archived and does not have the force of law.
- Canada Revenue Agency, line 12100 interest and other investment income, reporting of interest and investment income; updated January 20, 2026.
- Canada Revenue Agency, about the TFSA, general treatment of investment income, capital gains, and withdrawals.
- Canada Revenue Agency, making RRSP withdrawals, tax treatment of income while it remains in the plan and withdrawals.
- Canada Revenue Agency, withdrawals and transfers out of an FHSA, qualifying and taxable withdrawals; checked October 16, 2026.
- Canada Revenue Agency, payments from an RESP, educational assistance payment components and beneficiary taxation.