
VEQT vs XEQT: same fee, a different Canada tilt and payout schedule
VEQT and XEQT are both Canadian-listed, globally diversified all-equity portfolios that rebalance their underlying holdings, and both providers now list a 0.17% management fee. Their US allocations are close; VEQT holds more Canadian and emerging-market equity, while XEQT holds more developed-international equity. VEQT also distributes annually and XEQT quarterly.
No account type gives either an automatic tax advantage. Both use Canadian fund wrappers, so foreign withholding can occur inside the portfolio in a TFSA, RRSP or taxable account alike. The choice usually comes down to the regional tilt you prefer, distribution timing, implementation, and whether a nearly all-equity portfolio suits you at all.
Where the money is invested
Information checked October 14, 2026. VEQT figures come from Vanguard's factsheet dated August 31, 2026, with its MER as of March 31, 2026. XEQT figures come from BlackRock's factsheet dated September 30, 2026. The snapshots are a month apart.
| Feature | VEQT | XEQT |
|---|---|---|
| Provider | Vanguard Investments Canada | BlackRock Asset Management Canada, iShares |
| Mandate | Strategic allocation of about 100% equity through underlying Vanguard funds | 100% equity target through underlying iShares ETFs, continuously monitored and rebalanced |
| Listing / currency | TSX / CAD | TSX / CAD |
| Management fee | 0.17%, effective November 18, 2025 | 0.17%, effective December 18, 2025 |
| Reported MER | 0.22% (as of March 31, 2026) | 0.19% |
| Distribution frequency | Annual | Quarterly |
| Canada allocation | 30.6% | 24.89% |
| US allocation | 44.8% | 45.77% |
| Developed international | 17.6% | 24.26% |
| Emerging markets | 7.0% | 4.89% |
| Registered plans | Provider lists registered-plan eligibility | Provider lists registered-plan eligibility |
Sources: Vanguard's VEQT product page, VEQT ETF Facts, BlackRock's XEQT product page, and XEQT's September 2026 factsheet, plus Vanguard's August 2026 VEQT factsheet.
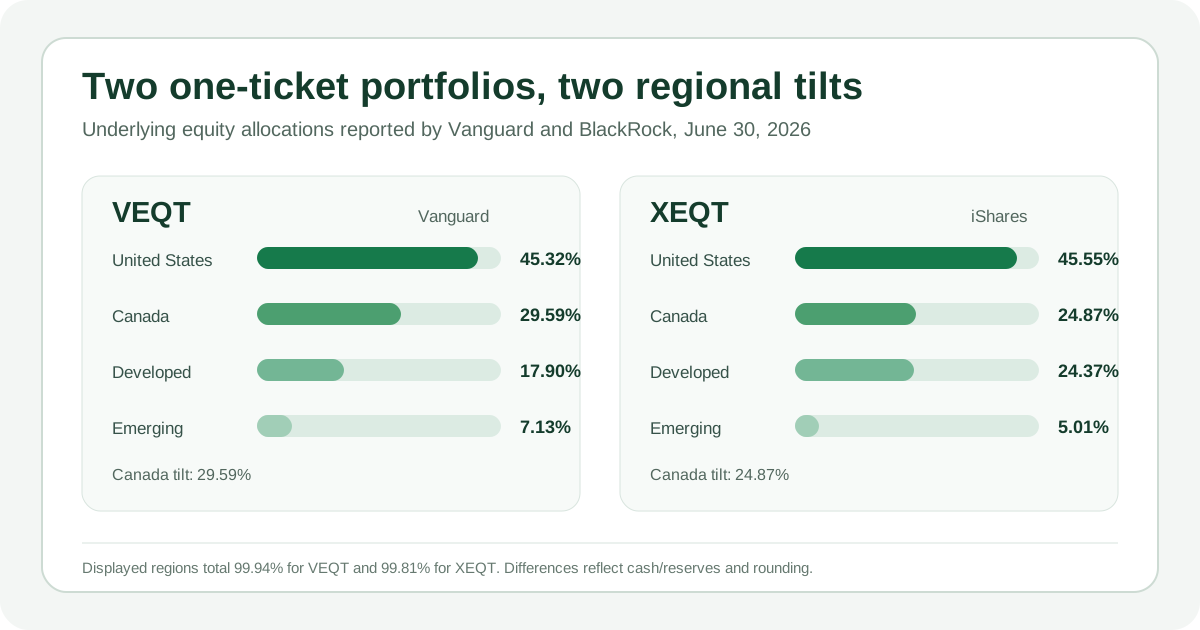
On the latest factsheets, the largest regional difference was Canada. VEQT reported 30.6% in its Canadian all-cap fund on August 31, compared with 24.89% for XEQT's Canadian equity holding on September 30. VEQT therefore had about 5.7 percentage points more Canadian equity. Both weights are far above Canada's share of the global public-equity market, which is commonly called home-country bias. The XEQT versus VFV guide shows how that home bias and global diversification compare with an S&P 500-only mandate.
A home tilt is not automatically a mistake. Canadian equities can line some assets up with Canadian-dollar spending, and Canadian corporations can pay eligible dividends that matter in a taxable account. It also concentrates more money in the Canadian market's particular mix, so it is worth recognizing as a deliberate choice rather than assuming an all-world label means market-cap weighting.
The US weights were almost the same: 44.8% for VEQT and a calculated 45.77% for XEQT after combining XEQT's two US underlying ETF positions. VEQT allocated 17.6% to developed markets outside North America and 7.0% to emerging markets. XEQT allocated 24.26% to developed international equities and 4.89% to emerging markets. VEQT's higher Canada and emerging-market weights are balanced by XEQT's higher developed-international allocation.
These are portfolio snapshots, not fixed promises. Market movements, cash flows, provider decisions within the mandate, and rebalancing bands can change actual weights. The official documents should be checked when a precise current allocation is material.
The same fee, with MERs from different periods
Both providers reduced the management fee to 0.17% in late 2025. Vanguard's reduction took effect on November 18, while BlackRock's took effect on December 18. A management fee is not the same as the management expense ratio. MER is backward-looking and includes the management fee plus certain operating expenses and applicable taxes over a reporting period.
XEQT reports a 0.19% MER on its September 30, 2026 factsheet. VEQT's August 31, 2026 factsheet reports a 0.22% MER as of March 31, 2026, down from the 0.24% shown in its November 2025 ETF Facts, which Vanguard said did not yet reflect the fee reduction. With identical 0.17% management fees, it would be misleading to treat the three-basis-point reported gap as a permanent forward cost. MERs are backward-looking, and later reporting periods will show more of the late-2025 reductions.
VEQT pays once a year; XEQT pays quarterly
Vanguard lists VEQT's distribution frequency as annual, while BlackRock lists XEQT's as quarterly. Frequency is not total return, yield or tax efficiency: a distribution lowers the fund's net asset value by the amount paid, all else equal. In a taxable account, the tax character on the T3 slip matters more than how many payments arrive.
Both portfolios can distribute Canadian dividends, foreign income, capital gains, return of capital, or other amounts depending on the year. BlackRock's official distribution FAQ and Vanguard's tax centre explain that brokers provide the tax slips and that tax characteristics may be finalized after year-end. Reinvested or non-cash distributions can also affect adjusted cost base.
Same job, different building blocks
VEQT and XEQT aim to provide a complete equity allocation in one Canadian-listed ETF. Vanguard says VEQT seeks long-term capital growth by investing primarily in equity ETFs, with a strategic allocation of about 100% equity. BlackRock describes XEQT as a broadly diversified portfolio of equity ETFs with a 100% equity target. Both providers monitor the mix and rebalance rather than requiring the unit holder to trade each region separately.
Both hold thousands of companies across Canada, the United States, developed international markets and emerging markets; both trade in Canadian dollars on the TSX and are listed by their providers as eligible for registered plans; and neither has a strategic bond allocation to soften equity losses.
Underneath, VEQT uses Vanguard Canada equity index funds and XEQT uses iShares funds, including two separate US exposures in its September 2026 holdings. Different index families, sampling methods, rebalancing trades, cash levels and tax lots can produce return differences even when the regional weights look similar, so compare tracking over a suitable period and after costs rather than from one fee number.
Delegating rebalancing to the fund removes the need to calculate targets and place four or more trades, though it does not guarantee identical timing between the two or prevent losses. Trading in Canadian dollars is not the same as hedging: both carry substantial foreign-currency exposure, the official materials do not present either as a fully hedged global portfolio, and currency moves can help or hurt in any period.
Accounts: one wrapper, one withholding result
TFSA. A TFSA generally shelters income and gains from Canadian tax if the account follows the TFSA rules, and both providers list their fund as eligible for registered plans. Eligibility does not make a nearly 100% equity portfolio right for a near-term goal or for someone who cannot tolerate a large decline. Vanguard's withholding-tax guide shows that when a Canadian-listed ETF receives US dividends directly or through a US-listed ETF, withholding can remain an internal cost in a TFSA, and the investor generally cannot claim a foreign tax credit for it.
RRSP. An RRSP defers Canadian tax while assets stay in the plan, and withdrawals are generally included in income. The Canada-US treaty can exempt qualifying US dividends paid to a retirement arrangement when a US-listed security is held directly, but VEQT and XEQT are Canadian-listed wrappers, so that benefit does not remove withholding inside their foreign layers. That is a structural cost to set against the convenience of one-ticket diversification; rebuilding the allocation from separate ETFs adds trading, currency, tracking and behavioural complexity of its own.
Taxable account. Distributions can carry different Canadian tax treatments: foreign income is generally taxed differently from eligible Canadian dividends, and foreign tax paid may support a foreign tax credit when properly reported. The T3 slip and the provider's annual tax-characteristics information are the starting records, but they do not replace your own adjusted-cost-base history.
Purchases, sales, reinvested distributions, return of capital, and certain non-cash distributions can change adjusted cost base. Holding the same ETF at multiple institutions can make recordkeeping harder because ACB is calculated across identical properties owned by the taxpayer. The ETF distributions and ACB guide covers this workflow.
Before choosing, or switching
Look at the portfolio, not last year's returns. VEQT has the larger Canadian and emerging-market weights at the current snapshot and XEQT the larger developed-international weight; decide whether that difference is worth monitoring, because switching later in a taxable account can realize gains or losses.
Compare costs on a like-for-like basis: identical 0.17% management fees, reported MERs from different backward-looking periods, plus any commission, bid-ask spread and switching cost. Then match the account and horizon. Both funds can fall sharply; a TFSA withdrawal affects future contribution room under the TFSA rules, an RRSP withdrawal is generally taxable and the room is not restored, and a taxable sale can realize a capital gain or loss.
- Do the current regional targets match the intended equity allocation?
- Is an annual or quarterly distribution schedule operationally preferable?
- Can the investor remain invested through a severe all-equity drawdown?
- Would switching create taxable gains, trading costs, or duplicated holdings?
- Are current official documents, not cached quotes or old comparisons, being used?
Related reading
- VEQT account-location overview and XEQT account-location overview
- VFV vs VOO vs XEQT vs QQQ
- Foreign withholding tax in a TFSA, RRSP, and taxable account
- Canadian-listed vs US-listed ETFs
- Canadian stock account location
- XGRO vs XEQT: 80/20 or 100% equity in Canada?
Look up VEQT or XEQT
The screener gives an educational account-location read for each fund. Confirm current allocations with Vanguard and BlackRock.
Open VEQT in the screenerFrequently asked questions
Do VEQT and XEQT hold the same investments?
They cover similar regions but use different underlying funds and target weights. On the latest factsheets (VEQT August 31 and XEQT September 30, 2026), their US allocations were close, but VEQT had more Canada and emerging markets while XEQT had more developed international exposure.
Why is VEQT's MER higher if both charge a 0.17% fee?
Timing. Both providers cut the management fee to 0.17% in late 2025, but MER looks backward over a reporting period. VEQT's August 31, 2026 factsheet reports a 0.22% MER as of March 31, 2026, while XEQT's September 30, 2026 factsheet reports 0.19%. Later reporting periods will reflect more of the reductions.
Does VEQT pay distributions less often than XEQT?
Yes. Vanguard lists VEQT's distribution frequency as annual, and BlackRock lists XEQT's as quarterly. Frequency does not change total return; it affects cash-flow timing, and in a taxable account the tax character on the T3 slip matters more than the number of payments.
Does VEQT or XEQT avoid foreign withholding tax?
No. Both Canadian-listed funds receive foreign-source dividends through underlying holdings or ETFs, so foreign withholding can occur inside the fund structure. In a TFSA or RRSP, an investor generally cannot personally recover withholding paid within the Canadian fund wrapper.
Sources
- Vanguard Canada, VEQT product page, fee notice effective November 18, 2025.
- Vanguard Canada, VEQT factsheet, allocation, fee, and MER data as of August 31, 2026, with MER as of March 31, 2026.
- Vanguard Canada, VEQT ETF Facts, November 18, 2025.
- BlackRock Canada, XEQT product page, including fee, MER, distribution frequency, and registered-plan eligibility.
- BlackRock Canada, XEQT factsheet, portfolio and fee data as of September 30, 2026.
- BlackRock Canada, XEQT annual management report of fund performance, target allocation framework.
- Vanguard Canada, Foreign Withholding Taxes guide, 2023.
- BlackRock Canada, distributions and tax FAQ.
- Vanguard Canada tax centre.
- Department of Finance Canada, Canada-US Tax Convention, Article XXI.
- Canada Revenue Agency, qualified investments for registered plans.
- Canada Revenue Agency, TFSA withdrawals and contribution room, February 20, 2026.
- Canada Revenue Agency, RRSP withdrawals, January 29, 2026.
- Canada Revenue Agency, federal foreign tax credit, updated for the 2025 tax year.