
VDY vs VFV: Canadian dividends or US large caps?
Answer first: VDY is a concentrated Canadian dividend strategy; VFV is a US large-cap strategy. VDY fits a deliberate Canadian-income tilt. VFV fits a deliberate S&P 500 allocation. Neither is a complete substitute for the other, and the higher-yielding fund is not automatically the better investment.
Vanguard's June 30, 2026 factsheets make the contrast clear. VDY held 60 stocks, had 69.7% in its top 10, and reported a 3.2% portfolio equity yield. VFV's underlying portfolio held 506 stocks, had 38.0% in its top 10, and reported a 1.1% portfolio equity yield. VDY's management expense ratio (MER) was 0.22%; VFV's was 0.09%, both as of December 31, 2025.
The key question is not “income or growth?” Dividends are one part of total return, not an extra return. The useful question is which exposure the rest of the portfolio needs. VDY adds Canadian banks, pipelines, insurers, and energy producers. VFV adds large US companies and US-dollar exposure. A diversified portfolio may already own both groups through other funds.
VDY vs VFV comparison
Information checked July 31, 2026. Portfolio figures and management fees use Vanguard factsheets dated June 30, 2026. MERs are as of December 31, 2025. Investment counts, yields, and sector weights are snapshots, not forecasts.
| Feature | VDY | VFV |
|---|---|---|
| Portfolio role | Canadian high-dividend tilt | US large-cap equity exposure |
| Benchmark | FTSE Canada High Dividend Yield Index | S&P 500 Index |
| Geography | Canada | United States |
| June 30 stocks | 60 | 506 in the underlying portfolio |
| June 30 top-10 weight | 69.7% | 38.0% |
| June 30 equity yield | 3.2% | 1.1% |
| Management fee / MER | 0.20% / 0.22% | 0.08% / 0.09% |
| Distribution schedule | Monthly | Quarterly |
| Structure | Primarily holds Canadian dividend-paying stocks directly | Primarily holds the US-listed Vanguard S&P 500 ETF |
| Currency exposure | Primarily Canadian dollar | US dollar, not hedged to CAD |
| Risk rating | Medium | Medium |
| Plan eligibility | Vanguard lists RRSP, RRIF, RESP, TFSA, DPSP, RDSP, non-registered, and FHSA | |
What's in this guide
| What each fund actually owns | Country, stocks, and concentration |
| Why VDY's higher yield is not free | Index rules and total return |
| Fees, distributions, and trading | Recurring costs and cash flow |
| Currency and diversification | What CAD trading does not change |
| TFSA, RRSP, FHSA, and taxable | Account-specific tax treatment |
| A practical decision rule | Match the fund to the portfolio gap |
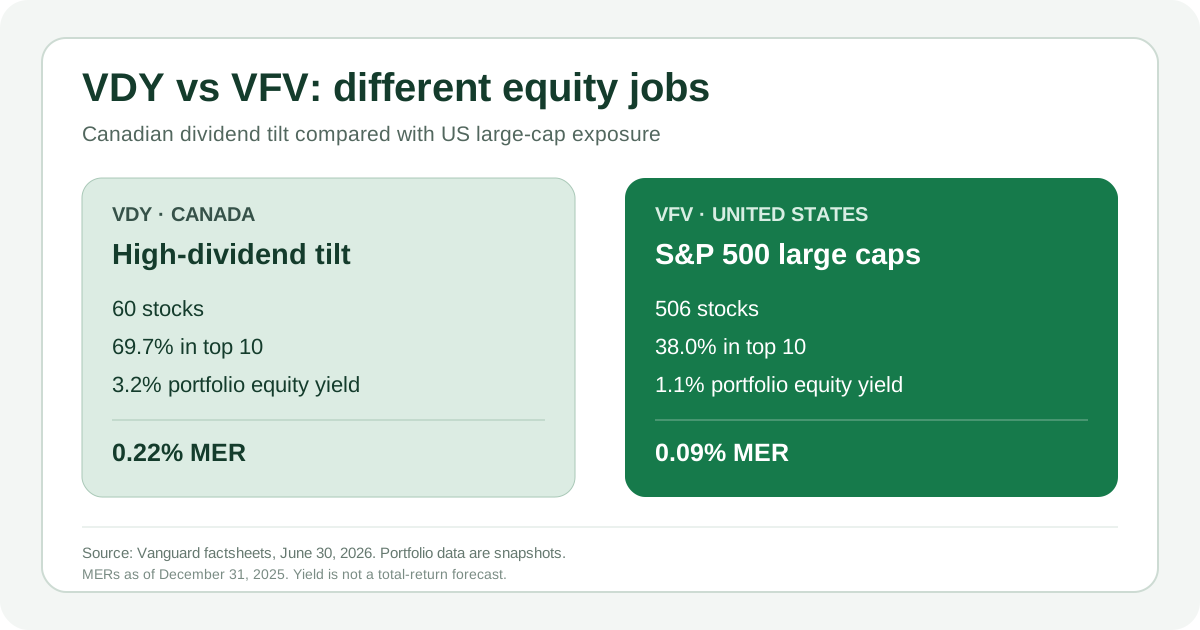
VDY and VFV own different countries and different risks
VDY tracks an index designed to represent Canadian companies with relatively high forecast dividend yields. FTSE Russell's October 2025 ground rules start with large-, mid-, and small-cap companies in the FTSE Canada All Cap Domestic Index. The rules remove real estate investment trusts, companies that are not paying a dividend, and companies not forecast to pay one over the next 12 months. The index is reviewed annually and uses market-cap weighting after its screens.
That process does not produce an even basket of dividend stocks. VDY's June factsheet showed 60.7% in financials and 26.7% in energy, or 87.4% combined. Royal Bank represented 16.4% by itself. Five large banks, Enbridge, Canadian Natural Resources, TC Energy, Manulife, and Suncor filled the top 10. A dividend label can therefore hide a large sector and company concentration.
VFV tracks the S&P 500, a float-adjusted market-cap-weighted index of US large caps. S&P Dow Jones Indices says it includes 500 leading companies and covers about 80% of available US market capitalization. VFV mainly implements that exposure through the US-listed Vanguard S&P 500 ETF.
VFV is broader by stock count and sector, but it is still a single-country large-cap fund. Its June factsheet showed 38.0% in information technology, and its ten largest holdings were also 38.0%. Nvidia, Apple, Alphabet, Microsoft, Amazon, and Broadcom dominated the top of the list. VDY's concentration is mostly Canadian financials and energy; VFV's is mostly US mega-caps and technology.
The sector percentages are useful fingerprints, not a perfect side-by-side taxonomy. Vanguard classifies VDY using the Industry Classification Benchmark and VFV using the Global Industry Classification Standard. The systems can group some businesses differently.
VDY's higher yield comes with a deliberate tilt
VDY's reported 3.2% portfolio equity yield was almost three times VFV's 1.1% as of June 30. That does not mean VDY had three times the expected return. Total return combines distributions with the change in unit value. A cash distribution is not an extra return: after it is paid, the fund has less cash and its unit value reflects that outflow, all else equal.
A high yield can reflect a mature business that returns excess cash. It can also rise because a stock's price fell faster than its expected dividend, possibly signalling concern about future profits or a cut. FTSE's rules use forecast dividends and apply additional proprietary screens, but they do not guarantee any company's payment.
VDY is also not a dividend-growth screen. The benchmark is designed around relatively high forecast yield, while a dividend-growth strategy asks whether companies have consistently raised payments. Those approaches can hold different companies and behave differently. “Dividend ETF” is a category, not one strategy.
For an investor spending portfolio cash flow, VDY's monthly schedule may be operationally convenient. For an investor reinvesting everything, monthly versus quarterly payments are mostly a cash-management detail. A brokerage's dividend reinvestment rules, fractional-unit support, and timing can matter more than the calendar.
VFV has the lower current recurring cost
Vanguard reports a 0.20% management fee and 0.22% MER for VDY, compared with 0.08% and 0.09% for VFV. The 0.13-percentage-point MER gap is about $13 a year per $10,000 invested, or $130 per $100,000, using a simple one-year illustration before compounding and changes in value.
The fee difference is real, but it does not make two different portfolios interchangeable. Paying less for US large caps is not a bargain if the intended allocation was Canadian dividend stocks. Paying more for VDY is not justified merely because its current yield is higher.
ETF Facts dated July 16, 2026 reported average bid-ask spreads of 0.026% for VDY and 0.018% for VFV over the 12 months ended May 31, 2026. These are historical averages, not promised trading costs. Live spreads, commissions, automatic-purchase support, and dividend-reinvestment policies depend on the market and brokerage.
Both trade in CAD, but only VFV adds US-dollar exposure
VDY and VFV trade in Canadian dollars on the Toronto Stock Exchange. That describes the transaction currency, not the location of the businesses or the currency risk.
VDY's companies are Canadian, though many earn revenue abroad and remain sensitive to global commodity prices and currencies. VFV's economic exposure is US-dollar based and is not hedged to CAD. Its Canadian-dollar return therefore reflects both the US stocks and the CAD/USD exchange rate. A weaker Canadian dollar can lift the Canadian-dollar value of US assets; a stronger Canadian dollar can reduce it.
Owning both can diversify country and currency exposure, but two ETFs do not automatically make a complete portfolio. The pair omits developed markets outside North America, emerging markets, and bonds. It also creates a strong Canadian dividend tilt plus a US large-cap tilt.
If an investor already owns a global asset-allocation fund, adding either ETF changes the regional weights rather than filling an empty category. The XEQT vs VFV comparison shows the difference between a global all-equity portfolio and a US-only sleeve. The ETF comparison hub puts listing, currency, and account location in a wider framework.
VDY vs VFV by Canadian account type
Vanguard lists both ETFs as eligible for the major Canadian registered plans. Eligibility only means an account may hold the fund. It does not establish which fund suits an investor's plan, risk, or withdrawal date.
TFSA
CRA says TFSA interest, dividends, and capital gains are generally tax-free when the account rules are followed. VDY's Canadian dividends therefore do not need the dividend tax credit inside a TFSA. VFV has a separate cross-border cost: BlackRock's December 2025 withholding-tax guide says a Canadian-listed ETF holding US stocks faces US dividend withholding in a TFSA, and that tax is a net cost rather than a personal credit.
This gives VDY cleaner withholding treatment, not an automatic TFSA victory. The more important decision remains whether the portfolio needs Canadian dividend exposure or US large caps.
RRSP
VDY's Canadian holdings do not face US dividend withholding. VFV's Canadian wrapper does. Treaty relief generally exempts eligible US stocks or US-listed ETFs held directly in an RRSP or RRIF, but it does not flow through VFV because the Canadian fund receives the US dividends first. The guide to Canadian-listed versus US-listed ETFs explains why a direct US-listed holding can change withholding treatment while adding currency-conversion and implementation trade-offs.
FHSA
The withholding result is broadly similar to a TFSA for these funds. CRA's foreign-tax-credit folio says foreign taxes and income inside a TFSA or RRSP are excluded from the credit calculation, and the same approach may apply to other registered plans. A home-purchase timeline can matter much more. Both ETF Facts documents assign a medium risk rating, and either fund can fall sharply. Money required for a near-term qualifying withdrawal may not have enough time to recover. The FHSA investment guide covers the qualified-investment and time-horizon framework.
Taxable account
VDY's distributions may include eligible dividends designated by the Canadian mutual fund trust. CRA says taxable Canadian-corporation dividends reported on a T3 can qualify for the federal dividend tax credit, with provincial or territorial treatment varying. VFV's US dividends are foreign income and do not qualify for that credit. Foreign tax paid may support a foreign tax credit when the required foreign income is reported, subject to the investor's T3 slip and personal calculation.
Do not assume every VDY cash payment is entirely eligible dividends or every VFV payment has the same tax character each year. CRA says mutual fund distributions can combine dividends, foreign income, capital gains, other income, and return of capital. Reinvested amounts remain reportable, and return of capital changes adjusted cost base.
Selling one ETF to buy the other can realize a capital gain or loss. In a taxable account, the tax and record-keeping consequences can outweigh a small annual fee difference. See the ETF distributions and adjusted cost base guide before treating a distribution as simple cash yield.
A practical VDY vs VFV decision rule
Start with the portfolio gap, then evaluate the ticker. VDY describes a Canadian high-dividend tilt with heavy financial and energy exposure. VFV describes US large-cap exposure with heavy mega-cap and technology exposure. Neither description is a recommendation.
- Map the Canadian and US exposure already held inside every fund.
- Decide whether the desired result is current cash flow, regional diversification, or a sector tilt.
- Measure concentration at the company and sector level, not just the number of ETFs.
- Compare the 0.13-percentage-point MER gap with the value of the intended exposure.
- Check withholding tax, tax-slip character, live trading costs, and any realized gain before switching.
Holding both can be coherent when the weights are intentional. It combines two different countries and business mixes. It can also duplicate exposures already owned and leave large global gaps. A written target allocation is more useful than choosing whichever fund has the higher recent return or distribution yield.
Related reading
- ETF account-location comparison hub: VFV, VOO, XEQT, and QQQ
- XEQT vs VFV: global equity or US large caps?
- VUN vs VFV: total US market or S&P 500?
- Eligible dividends and the Canadian dividend tax credit
- Foreign withholding tax by Canadian account type
Check each holding in context
Use the free screener for an educational account-location overview, then confirm the latest issuer documents, tax information, and brokerage costs.
Search VDY in the screenerFrequently asked questions
Is VDY or VFV better?
Neither is universally better because they fill different portfolio roles. VDY is a concentrated Canadian high-dividend strategy. VFV is a broader US large-cap strategy with a lower current fee. The decision depends on the exposure missing from the rest of the portfolio, not yield alone.
Does VDY pay eligible dividends?
VDY holds Canadian dividend-paying companies, and a Canadian mutual fund trust can designate eligible dividends to unitholders. The actual tax character of an ETF distribution can include more than one component and can change each year, so taxable-account investors should use the fund's annual tax information and their T3 slip.
Is VFV subject to US withholding tax in an RRSP?
Yes, generally. VFV is a Canadian-listed fund that primarily holds a US-domiciled underlying ETF. US dividend withholding therefore remains a fund cost even when VFV is held in an RRSP. Treaty relief generally applies when eligible US-listed stocks or ETFs are held directly in an RRSP or RRIF.
Are VDY and VFV currency hedged?
VDY invests in Canadian companies and trades in Canadian dollars. VFV also trades in Canadian dollars, but its US stock exposure is not hedged to the Canadian dollar. VFV's Canadian-dollar return therefore reflects both the US stocks and changes in the CAD/USD exchange rate.
Can I hold both VDY and VFV?
Yes. They have different countries and holdings, so owning both can combine a Canadian dividend tilt with US large-cap exposure. The mix still omits many markets and may duplicate Canada and US exposure already inside an asset-allocation ETF.
Sources
- Vanguard Canada, VDY product page, current product information and documents checked July 31, 2026.
- Vanguard Canada, VDY factsheet, objective, benchmark, fee, MER, assets, eligibility, holdings, sectors, equity yield, and distribution schedule as of June 30, 2026.
- Vanguard Canada, VDY ETF Facts, July 16, 2026, including May 31 holdings, concentration, spread, cost, and risk rating.
- Vanguard Canada, VFV product page, current product information and documents checked July 31, 2026.
- Vanguard Canada, VFV factsheet, objective, structure, benchmark, fee, MER, assets, eligibility, holdings, sectors, equity yield, and distribution schedule as of June 30, 2026.
- Vanguard Canada, VFV ETF Facts, July 16, 2026, including May 31 holdings, concentration, spread, cost, and risk rating.
- FTSE Russell, FTSE Canada High Dividend Yield Index Ground Rules, version 2.3, October 2025, index objective, universe, dividend screens, REIT exclusion, and annual review.
- S&P Dow Jones Indices, S&P 500, large-cap description and approximate coverage of available US market capitalization, checked July 31, 2026.
- BlackRock Canada, Understanding Foreign Withholding Tax, December 2025, Canadian-listed US equity fund treatment in RRSP, TFSA, and taxable accounts.
- Canada Revenue Agency, What is a TFSA, updated February 20, 2026, including qualified investments and the general Canadian tax treatment of TFSA income and gains.
- Canada Revenue Agency, Federal dividend tax credit, updated April 23, 2026, including the exclusion of foreign dividends.
- Canada Revenue Agency, Federal foreign tax credit, updated July 10, 2026, eligibility and calculation framework.
- Canada Revenue Agency, Income Tax Folio S5-F2-C1, effective March 31, 2026, including foreign tax credit treatment for TFSAs, RRSPs, and other registered plans.
- Canada Revenue Agency, Tax treatment of mutual funds, updated February 5, 2026, distribution types, T3 reporting, reinvested distributions, sales, and adjusted cost base.