
XIC vs ZCN: same index, fees and account fit
Answer first: XIC and ZCN are unusually close substitutes. Both trade in Canadian dollars on the Toronto Stock Exchange, track the S&P/TSX Capped Composite Index, distribute quarterly, and currently report a 0.05% management fee and 0.06% management expense ratio, or MER. For the same amount invested, their core Canadian stock exposure and published ongoing cost are effectively the same.
XIC is older and larger. ZCN is managed by BMO rather than BlackRock. Those differences may affect brokerage features, trading spreads, or personal preferences, but they do not create a clear expected-return or account-location winner. A new investor can focus on execution and portfolio fit. An existing holder should have a stronger reason than brand preference before switching, especially in a taxable account.
XIC versus ZCN at a glance
Changing figures have explicit dates. ZCN portfolio data are at August 31, 2026. XIC holdings and asset data are at September 28, 2026. Issuer pages were checked September 29, 2026.
| Factor | XIC | ZCN | Practical read |
|---|---|---|---|
| Provider | BlackRock iShares Canada | BMO Global Asset Management | Different managers, same benchmark |
| Benchmark | S&P/TSX Capped Composite Index | S&P/TSX Capped Composite Index | Same market exposure by design |
| Management fee / MER | 0.05% / 0.06% | 0.05% / 0.06% | No current published fee winner |
| Portfolio count | 217 holdings at September 28 | 220 securities at August 31 | Different dates can explain small count gaps |
| Net assets | $35.14 billion at September 28 | $18.37 billion at August 31 | Both are established, large funds |
| Launch | February 16, 2001 | May 29, 2009 | XIC has the longer live fund history |
| Trading / distributions | TSX in CAD / quarterly | TSX in CAD / quarterly | Same basic trading and payment schedule |
| Published distribution yield | 2.00% at September 25 | 2.00% at August 31 | A changing snapshot, not expected return |
The figures come from the issuers' XIC product page and ZCN factsheet. Management fee and MER are different measures. The management fee pays the manager, while MER also captures applicable operating expenses and taxes for a reporting period.
What's in this guide
| Shared index | Why the portfolios should behave alike |
| Real differences | Fund history, size, holdings, and provider |
| Costs and trading | Why the live spread can matter more than the ticker |
| Account location | TFSA, RRSP, FHSA, RESP, and taxable accounts |
| Switching or holding both | Tax and duplication consequences |
| Decision framework | A short implementation checklist |
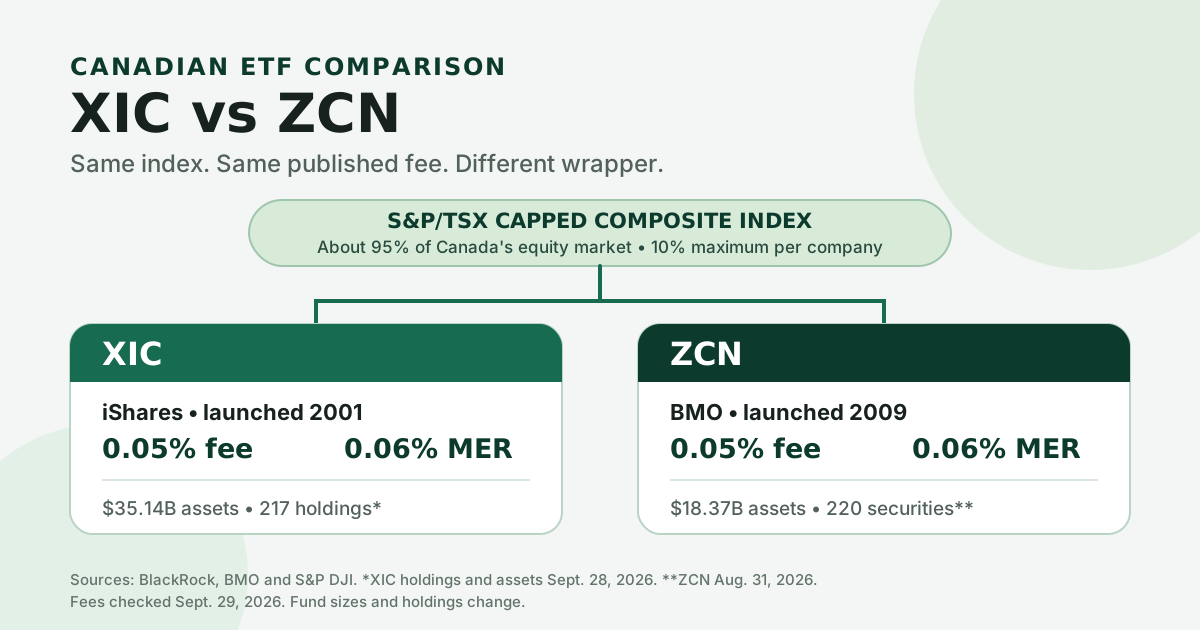
Both funds track the same capped Canadian index
BlackRock says XIC seeks to replicate the S&P/TSX Capped Composite Index, net of expenses. BMO describes the same objective for ZCN and says it holds the index constituents in the same proportions. This is stronger overlap than two funds that merely target the same country or asset class.
S&P Dow Jones Indices says the benchmark contains the S&P/TSX Composite constituents but caps each company at 10%. The parent index covers about 95% of the Canadian equity market. It is float-adjusted market-cap weighted, so larger publicly tradable companies receive larger weights until the cap becomes binding.
The benchmark remains concentrated by global standards. BMO's August 31 snapshot placed 34.00% in financials, 19.02% in materials, and 16.87% in energy. Those three sectors totalled 69.89%. Royal Bank, TD Bank, and Shopify were the three largest holdings. XIC follows the same index, so its exposure should be very close apart from cash, portfolio-management timing, and minor implementation effects.
A 10% company cap controls single-stock concentration, not country or sector concentration. Neither ETF is a complete global portfolio. The meaningful decision is first whether broad Canadian equity belongs in the overall allocation, then which wrapper implements that allocation efficiently.
The differences are operational, not strategic
XIC launched in 2001. ZCN launched in 2009, but BMO notes that it began tracking the present S&P/TSX Capped Composite Index on September 21, 2012 and followed the Dow Jones Canada Titans 60 Index before then. That benchmark history makes since-inception comparisons unsuitable for deciding which current implementation is better.
Fund size differs. BlackRock reported $35.14 billion of net assets for XIC on September 28, 2026. BMO reported $18.37 billion for ZCN on August 31. Both amounts are large enough that size alone offers little help. A larger fund does not own a better version of the index, guarantee a tighter spread for a particular order, or promise a higher future return.
The portfolio counts were 217 for XIC on September 28 and 220 for ZCN on August 31. The dates are nearly a month apart and straddle index and corporate activity. A three-security gap is not evidence that ZCN has meaningfully broader exposure. Position weights matter more than a raw count, particularly when the smallest positions are tiny.
The provider can still matter to implementation. A brokerage may support recurring purchases, fractional units, or commission-free transactions for one ticker and not the other. Dividend reinvestment rules and minimum whole-unit requirements can also differ by brokerage. These are account-platform features, not properties of the benchmark, so check the broker's current terms.
Fees match, so focus on tracking and the actual trade
Each issuer currently publishes a 0.05% management fee and 0.06% MER. Applied mechanically, a 0.06% MER is about $6 a year for every $10,000 invested. The amount is deducted within the fund rather than billed as a separate account charge. Fees can change, and MER is backward-looking for a reporting period.
The latest issuer figures show how close same-index funds can be. For periods ending August 31, 2026, both reported the same annualized net asset value returns to two decimal places: 29.81% for one year, 24.66% for three years, 15.20% for five years, and 12.78% for ten years. These are past returns, not forecasts. Their value here is simply that no persistent return gap is visible in the published long-period snapshots.
A buyer still pays the market price, not the last published NAV. Check the live bid and ask, avoid treating the previous close as a guaranteed execution price, and consider a limit order when price control matters. A one-time spread or commission can exceed a tiny annual difference between otherwise similar funds. In this comparison, there is not even a published MER difference to offset that trading cost.
Distribution yield is also a weak tie-breaker. Each issuer showed 2.00% on its latest available date, but the dates and calculation disclosures differ. Yield moves with distributions and NAV, excludes capital appreciation, and is not a promise. Total return and the fund's role in the portfolio matter more.
XIC vs ZCN in a TFSA, RRSP, FHSA, RESP, or taxable account
Eligibility: both ETFs trade on the TSX. CRA's qualified-investment folio says ETF units listed on a designated stock exchange are generally qualified investments for registered plans, and Finance Canada lists the TSX as designated. This supports general eligibility for TFSAs, RRSPs, FHSAs, RESPs, RRIFs, and RDSPs. Eligibility does not establish suitability.
TFSA: CRA says interest, dividends, and capital gains earned in a TFSA are generally tax-free. Because XIC and ZCN track the same Canadian index, the TFSA does not favour one wrapper. Contribution room, risk, time horizon, and the overall Canadian allocation deserve more attention.
RRSP: CRA says investment income is usually exempt from tax while it remains in an RRSP and withdrawals are generally taxable. Neither ticker receives a special advantage over the other. Both are Canadian-listed wrappers that primarily hold Canadian securities, so this is not the US-dividend withholding comparison that can arise between Canadian-listed and US-listed wrappers.
FHSA and RESP: these are equity funds and can lose substantial value. A home purchase or education bill can have a fixed date. The site's FHSA investment guide and RESP account-location guide explain why the withdrawal horizon can matter more than a product tie-breaker.
Taxable account: CRA says mutual fund distributions can include Canadian dividends, capital gains, other income, foreign income, and return of capital. Canadian dividends distributed and properly designated by the fund may support a dividend tax credit, while return of capital reduces adjusted cost base. Reinvested taxable distributions still need to be reported and can increase cost base. Use the T3 slip and the issuer's annual tax factors rather than assuming the entire cash payment is an eligible dividend. The ETF distributions and adjusted cost base guide covers the ledger.
Switching or holding both rarely improves the exposure
Selling XIC to buy ZCN, or the reverse, leaves the investor tracking the same index. In a taxable account, the sale can realize a capital gain or loss. In any account, the switch can add a spread, commission, time out of the market, and administrative work. A change may still make sense when brokerage support or account consolidation solves a real problem, but the exposure itself is not upgraded.
If a taxable position is at a loss, do not assume that buying the other ticker automatically avoids Canada's superficial-loss rule. The rule considers timing, affiliated persons, and identical property. CRA's archived interpretation bulletin says whether properties are identical is a question of fact based on their material qualities. The bulletin is not law, and two funds following the same index deserve careful review. The site's 61-day superficial-loss guide explains the framework, but a tax professional may be appropriate when the result is material.
Holding both is not harmful by itself, but it adds little diversification. The same large banks, resource companies, and other index constituents drive both funds. Splitting one Canadian sleeve between two managers can reduce manager concentration, but it also creates another line item, another distribution history, and another adjusted-cost-base pool in a taxable account.
For a genuinely different Canadian equity comparison, the sibling VCN vs XIC guide examines two benchmark methodologies. Even there, portfolio overlap is high. The larger diversification question is how much Canada belongs beside US, international, emerging-market, and fixed-income exposure.
A practical XIC vs ZCN decision framework
If broad Canadian equity is the intended portfolio sleeve, use this order of operations:
- Confirm the allocation first. The shared benchmark means Canadian country and sector exposure matters far more than the logo.
- Compare the live trade. Review the bid-ask spread, commission, order type, and dollar amount when placing an order.
- Check brokerage automation. Recurring buys, fractional units, and dividend reinvestment can break the tie for small regular contributions.
- Avoid unnecessary taxable switches. Estimate realized gains or losses and record-keeping consequences before changing wrappers.
- Recheck issuer documents. Fees, tax character, holdings, and platform support can change after this article's as-of date.
The broader ETF account-location comparison hub explains when listings, currency, withholding tax, and account choice create real structural differences. XIC versus ZCN is the opposite case: same benchmark, same published fee, and no universal winner. A simple, low-friction implementation is a reasonable outcome.
Related reading
- ETF account-location comparison hub
- VCN vs XIC: fees, indexes and account fit
- Eligible dividends and the Canadian dividend tax credit
- ETF distributions and adjusted cost base
- Canadian stock and ETF account-location framework
Check each ticker in context
Use the free screener for an educational account-location overview, then verify the latest holdings and documents with each issuer.
Open XIC in the screenerFrequently asked questions
What is the main difference between XIC and ZCN?
Both track the S&P/TSX Capped Composite Index and currently publish the same management fee and MER. The practical differences are the manager, fund history, fund size, brokerage support, live trading price, and small portfolio differences caused by cash and timing.
Is XIC cheaper than ZCN?
No on the current published figures. BlackRock and BMO each report a 0.05% management fee and a 0.06% MER. That is about $6 a year per $10,000 invested if the rate stays unchanged.
Is XIC or ZCN better for a TFSA or RRSP?
The account label does not create a clear winner because the two Canadian-listed ETFs track the same Canadian equity index. Portfolio role, time horizon, trading workflow, and the complete allocation are more useful tie-breakers.
Should an investor hold both XIC and ZCN?
Holding both is possible, but it adds little diversification because both track the same index. It mainly splits one Canadian equity allocation between two managers and creates another position to administer.
Sources
- BlackRock iShares Canada, XIC product page, objective, benchmark, fees, assets, holdings count, yield, listing, and distributions; checked September 29, 2026.
- BMO ETFs, ZCN product page, product identity and current issuer resources; checked September 29, 2026.
- BMO Global Asset Management, ZCN factsheet, data as at August 31, 2026, including fees, assets, holdings, sectors, performance, yield, and benchmark history.
- S&P Dow Jones Indices, S&P/TSX Capped Composite, market coverage, constituent cap, and linked products; checked September 29, 2026.
- Canada Revenue Agency, Tax treatment of mutual funds, distribution types, reinvested distributions, return of capital, adjusted cost base, and dispositions; checked September 29, 2026.
- Canada Revenue Agency, Federal dividend tax credit, qualifying Canadian dividends and tax-slip boxes; checked September 29, 2026.
- Canada Revenue Agency, IT-387R2, Meaning of Identical Properties (archived), interpretive approach to identical property and its fact-specific nature; checked September 29, 2026.
- Canada Revenue Agency, What is a TFSA, ETF holdings and general tax treatment; checked September 29, 2026.
- Canada Revenue Agency, Registered Retirement Savings Plan, tax treatment while funds remain in the plan and on withdrawal; checked September 29, 2026.
- Canada Revenue Agency, Income Tax Folio S3-F10-C1, listed ETF units as qualified investments for registered plans.
- Department of Finance Canada, Designated Stock Exchanges, TSX designation; checked September 29, 2026.