
VGRO vs XGRO: same 80/20, more Canada or more overseas?
VGRO and XGRO are two versions of the same portfolio: Canadian-listed, automatically rebalanced, and targeting approximately 80% stocks and 20% bonds. VGRO currently holds more Canadian equity and a broader global bond sleeve; XGRO holds more developed-market equity outside North America and splits its bonds differently. Both charge a 0.17% management fee, and no account type favours either.
Cost is no longer an easy tiebreaker. Vanguard cut VGRO's management fee to 0.17% on November 18, 2025, and BlackRock cut XGRO's to 0.17% on December 18, 2025. When checked September 1, 2026, XGRO still displayed a lower reported MER, 0.20% versus 0.22%, but Vanguard says its published MER does not yet reflect its fee cut, so the gap is a lagging report rather than a permanent difference.
For a long-term investor already settled on 80/20, either fund is a defensible one-ticket choice, and steady contributions, risk fit and avoiding needless switches will likely matter more than a few points of regional weighting. If the open question is 80/20 versus all equity, start with XGRO vs XEQT.
Where each fund puts the 80% in stocks
Portfolio data are as of July 31, 2026. Allocations move with markets and rebalancing. Reported MERs use each fund's latest completed reporting period, while the management fees shown are current on September 1, 2026.
| Factor | VGRO | XGRO | Practical read |
|---|---|---|---|
| Strategic target | Approximately 80% equity, 20% fixed income | 80% equity, 20% fixed income | Same broad risk category and one-ticket purpose |
| Actual stock / bond weight | 81.63% / 18.35%, plus 0.02% reserves | About 80.19% / 19.58%, plus 0.22% cash and FX items | Small drift around the common target is normal |
| Equity split | US 36.62%; Canada 24.57%; developed ex-North America 14.78%; emerging 5.66% | US 36.22%; Canada 19.75%; developed EAFE 20.08%; emerging 4.14% | VGRO tilts more to Canada; XGRO tilts more to developed markets abroad |
| Bond design | Canadian aggregate, US aggregate, and global ex-US aggregate bonds; foreign bond funds are CAD-hedged | Canadian universe and short corporate bonds, plus US Treasury and investment-grade corporate bonds; foreign fixed-income currency exposure is hedged | Different building blocks, but both use high-quality bond diversification |
| Management fee | 0.17% | 0.17% | Equal published management fees after 2025 cuts |
| Reported MER | 0.22%; issuer says it does not yet reflect the fee cut | 0.20% | Not yet a clean forward comparison |
| Trading and distributions | TSX in CAD; quarterly distributions | TSX in CAD; quarterly distributions | No need to convert CAD to place either trade |
The figures come from the current Vanguard VGRO product page and BlackRock's July 2026 XGRO factsheet. XGRO's stock total and bond total above are sums of the underlying sleeves shown in that factsheet. Rounding can prevent totals from equalling exactly 100%.
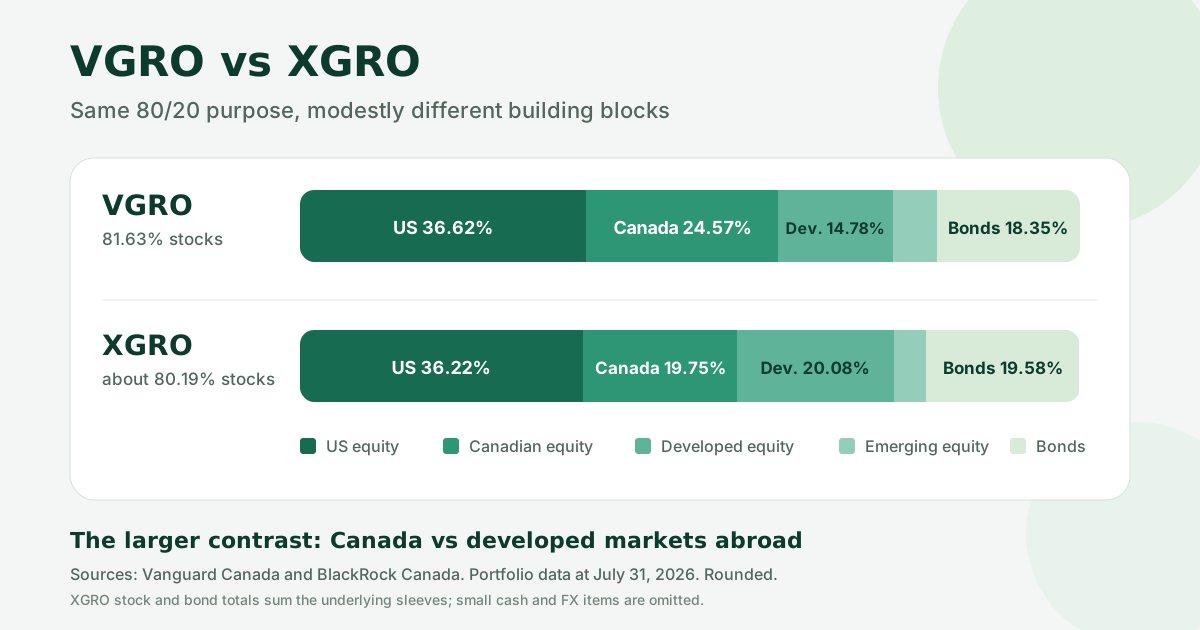
The US allocation is almost identical. At July 31, 2026, Vanguard reported 36.62% in its US total-market fund and BlackRock 36.22% in XGRO's US total-market sleeve, so much of the growth exposure comes from the same broad market through different underlying funds.
The split outside the United States is where they diverge. VGRO held 24.57% in Canadian equity and 14.78% in developed equity outside North America; XGRO held 19.75% in Canadian equity and 20.08% in developed EAFE equity. VGRO also reported 5.66% in emerging markets versus XGRO's 4.14%. The weights will move, but the design is clear: more home-country equity in VGRO, more developed international equity in XGRO.
Neither weighting is a forecast. More Canada means more exposure to the Canadian market's financial, energy and materials sectors; more developed international spreads weight across Europe, Japan, Australia and other developed markets. Future relative returns are unknowable, and picking last year's winning region defeats the point of a strategic allocation.
Trading in Canadian dollars does not remove the foreign-currency exposure of either stock portfolio, because overseas companies still earn and are valued in their own currencies. That is one reason daily returns can differ even when the funds own many of the same companies.
Two bond designs for the other 20%
VGRO's July 31 portfolio put 11.12% in Canadian aggregate bonds, 3.56% in US aggregate bonds, and 3.68% in global bonds outside the United States. Vanguard labels both foreign bond funds CAD-hedged. This spreads its fixed-income allocation across Canadian, US, and other non-US markets.
XGRO used four bond sleeves: 12.76% in Canadian universe bonds, 3.00% in short-term Canadian corporate bonds, 1.91% in US Treasuries, and 1.91% in US investment-grade corporate bonds. BlackRock's ETF Facts says XGRO seeks to hedge US-dollar and other foreign-currency exposure within the non-Canadian fixed-income asset class.
Hedging is more common in bonds because currency swings can swamp fixed income's lower expected volatility. The exact mix affects duration, credit exposure, yield and short-term returns, but about four-fifths of each ETF is still in equities, so the bond design does not make one a radically different portfolio.
Picking whichever fund's bonds did better recently is a weak method, because rates, credit spreads and currency hedges swing results over short periods. The better test is whether one published design fits a written policy well enough to choose it and stay with it.
The same 0.17% fee, and an MER gap that is out of date
On September 1, 2026, each issuer listed a 0.17% management fee. Vanguard's cut from 0.22% took effect November 18, 2025. BlackRock's cut from 0.18% took effect December 18, 2025. BlackRock's July 2026 factsheet still contains a stale 0.18% sentence in its overview, but its fee table, current product page, and August 10 product brief all show 0.17%. The management fee is not the whole MER, which also includes applicable taxes and operating expenses, but the two funds now start from the same published management-fee rate.
XGRO's product page listed a 0.20% MER; VGRO lists 0.22%, while warning that the figure does not yet reflect its fee cut because MER is calculated at the fund's fiscal year-end. Comparing $20 with $22 per $10,000 as if both described the same future period would be false precision. The next fully comparable reports may still differ, but take the size and direction from the issuers when they publish them.
Commissions, bid-ask spreads and execution count too. Both trade in Canadian dollars on the TSX, so neither needs a currency conversion to buy. A limit order during normal hours caps the purchase price, though it may not fill, and automatic purchases and fractional shares depend on the brokerage rather than the fund.
Switching an existing holding to chase a tiny cost or allocation edge can cost a spread, a commission, time out of the market and, in a non-registered account, a taxable capital gain or loss. That one-time cost can outweigh a small annual difference, especially when the future fee gap is not yet known.
First, is 80/20 the right mix?
Both funds package broad stock and bond markets into one TSX-listed ticker: contributions buy the current mix, distributions can be reinvested, and the manager rebalances. Vanguard says VGRO's asset mix may be reconstituted and rebalanced at the sub-advisor's discretion; BlackRock says XGRO is continuously monitored and automatically rebalanced as needed to maintain its asset-class targets.
Choosing either means accepting substantial equity exposure. Bonds can soften volatility and supply something to rebalance from, but an 80% stock portfolio can still fall a long way, and it is no substitute for cash, a GIC ladder or another capital-stability plan when the money is needed soon.
Ontario Securities Commission investor education says asset mix should reflect both risk tolerance and time horizon: a longer horizon can support more equity, while a near-term goal may need more cash or fixed income. Settle that before comparing issuers or recent returns.
The account doesn't separate them
TFSA and RRSP: both ETFs trade on the Toronto Stock Exchange. CRA's qualified-investment folio says units of ETFs listed on a designated stock exchange are generally qualified investments for registered plans, and the Department of Finance lists the TSX as a designated stock exchange. The account wrapper does not make an 80% equity portfolio suitable for every goal. A TFSA used for a near-term purchase can require a different risk level from a TFSA used for long-term retirement savings.
Both are Canadian-listed fund-of-funds, and BlackRock's foreign-withholding guide says Canadian-listed ETFs seeking US stock exposure face US withholding inside the fund whether the investor's account is taxable or non-taxable. Holding either in an RRSP does not create the treaty exemption available to US-listed securities held directly, so this shared structure gives no reason to prefer one. The foreign withholding tax guide explains the layers.
FHSA: both can be qualified investments, but the purchase date matters more than the ticker; money needed soon for a down payment may not have time to recover from an equity decline. The FHSA investment guide covers the timeline and withdrawal trade-offs.
Taxable account: each fund can distribute interest, Canadian dividends, foreign income, capital gains and return of capital, in a mix that changes by year. Interest and foreign non-business income are generally taxed differently from eligible Canadian dividends and capital gains, and foreign tax shown on a T3 may support a foreign tax credit subject to the rules. VGRO's larger Canadian weight and XGRO's larger developed-foreign weight could shift distribution character at the margin, but not in a fixed way or by enough to read from a headline yield. Reinvested distributions and return of capital can change adjusted cost base; see the ETF distributions and ACB guide.
Choosing, or reconsidering, between them
If 80/20 fits the goal, write down which remaining difference matters and why. A durable reason might be a preference for VGRO's larger Canadian allocation and global bond breadth, or for XGRO's larger developed-market allocation and its fixed-income mix.
- Can the plan withstand a substantial equity-market decline without selling?
- Is the money needed far enough in the future for an 80% stock allocation?
- Does one regional or bond design fit a written policy, rather than a market forecast?
- Does the brokerage support the desired recurring-purchase and reinvestment workflow?
- Would switching realize tax or trading costs that exceed the likely benefit?
Splitting money between the two creates no new risk category: a 50/50 mix stays close to 80/20 and mostly averages their regional and bond choices, at the cost of a second position to monitor. Simplicity has value when it keeps contributions and rebalancing easy to maintain.
Related reading
- ETF account-location comparison hub: VFV, VOO, XEQT, and QQQ
- XGRO vs XEQT: 80/20 or 100% equity?
- VEQT vs XEQT: two all-equity portfolios compared
- XEQT vs VFV: global equity or S&P 500?
- Canadian stock and ETF account-location framework
Look up VGRO or XGRO
The screener shows an educational account-location read for each fund. Confirm current weights and fees in the issuers' documents.
Open VGRO in the screenerFrequently asked questions
Does VGRO hold more Canadian stocks than XGRO?
Yes, on the July 31, 2026 snapshots: 24.57% Canadian equity in VGRO against 19.75% in XGRO. XGRO held more developed equity outside North America, 20.08% against 14.78%, and their US weights were within half a point.
Which is cheaper, VGRO or XGRO?
Both published a 0.17% management fee on September 1, 2026. XGRO displayed a 0.20% MER and VGRO displayed a 0.22% MER, but Vanguard explicitly said its MER did not yet reflect the November 18, 2025 fee cut. The displayed MERs therefore do not provide a clean forward-looking cost comparison.
Are VGRO's and XGRO's foreign bonds currency hedged?
Yes, in both cases. Vanguard labels VGRO's US and global bond funds CAD-hedged, and BlackRock's ETF Facts says XGRO seeks to hedge US-dollar and other foreign-currency exposure within its non-Canadian fixed income. Their foreign stocks are not hedged.
What happens if I split money between VGRO and XGRO?
Owning both is possible, but it adds a second holding without materially changing the overall 80/20 risk target. It can average their regional and bond design choices, but it also creates another balance to monitor. One fund is usually simpler when the intended allocation is already 80% stocks and 20% bonds.
Sources
- Vanguard Canada, VGRO product page, objective, target, holdings and asset allocation at July 31, 2026; fees, distributions, listing, and issuer MER warning checked September 1, 2026.
- Vanguard Canada, fee-cut announcement, November 18, 2025, confirming VGRO's management-fee reduction to 0.17%.
- BlackRock Canada, XGRO product page, objective, rebalancing, fees, registered-plan eligibility, assets, and distribution details checked September 1, 2026.
- BlackRock Canada, XGRO factsheet, portfolio and fee data at July 31, 2026.
- BlackRock Canada, iShares Core ETF Portfolios product brief, August 10, 2026, underlying equity and fixed-income building blocks and current management fee.
- BlackRock Canada, XGRO ETF Facts, June 19, 2026, including objective, strategic allocation, risk disclosure, and foreign fixed-income currency-hedging policy.
- Canada Revenue Agency, Income Tax Folio S3-F10-C1, listed ETF units as qualified investments for registered plans.
- Department of Finance Canada, Designated Stock Exchanges, TSX designation confirmed September 1, 2026.
- GetSmarterAboutMoney.ca, How to make an investment policy statement, Ontario Securities Commission investor education on goals, time horizon, risk tolerance, and asset allocation, checked September 1, 2026.
- BlackRock Canada, Understanding Foreign Withholding Tax, December 2025, Canadian-listed ETF treatment by account type.
- Canada Revenue Agency, Tax treatment of mutual funds, updated in 2026, T3 income categories and foreign tax credit reporting.