
XEI vs VDY: same fee, very different concentration
XEI and VDY charge the same 0.22% management expense ratio and both pay monthly, so what separates them is concentration. XEI currently spreads its money more evenly across 75 holdings and several dividend-heavy sectors; VDY holds 60 stocks but commits far more to its largest banks and energy companies.
XEI is the less concentrated of the two dividend strategies, while VDY tilts harder toward Canada's largest high-yield companies. Neither is a complete global portfolio, and a higher recent yield or return does not make either the winner. Decide on the exposure first, then check how it overlaps with the Canadian banks, pipelines, utilities and energy producers you already own.
How concentrated each fund is
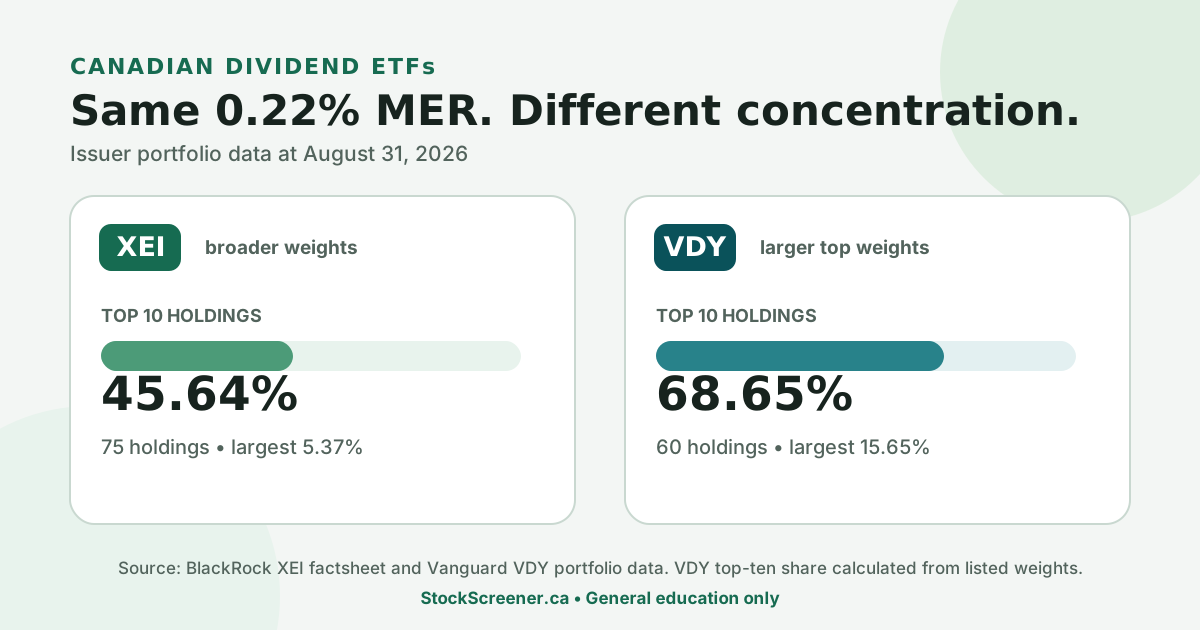
At August 31, 2026, XEI's ten largest positions were 45.64% of the portfolio. Its largest holding, Canadian Natural Resources, was 5.37%. VDY's ten disclosed largest positions added to 68.65%, led by Royal Bank at 15.65% and Toronto-Dominion Bank at 11.07%. Those are large differences in exposure, not rounding noise.
XEI's index construction helps explain the spread. S&P's Canadian index methodology selects 50 to 75 higher-yielding stocks from the S&P/TSX Composite and caps each company at 5% and each sector at 30% at quarterly rebalancing. Market moves can push live weights above those caps between rebalances.
VDY follows the FTSE Canada High Dividend Yield Index and held 60 stocks at August 31. Five of its ten largest holdings were major Canadian banks and four were energy companies or pipelines. That concentration helps when those businesses lead and hurts when they lag; it is neither good nor bad in itself, but it should be a deliberate choice.
Owning both does not remove the overlap, since the same banks and energy companies dominate both funds' largest positions. A combination shifts the weights without adding the United States, international markets or bonds, so look through the tickers before counting two funds as two sources of diversification.
XEI and VDY side by side
Dates matter. XEI's current holding count and yield are dated October 9, 2026. VDY's portfolio data are dated August 31, its yield September 30, and its market price October 9. The date-matched concentration comparison uses both issuers' August 31 portfolio data. Pages were checked October 13, 2026.
| Factor | XEI | VDY | Practical read |
|---|---|---|---|
| Full name | iShares S&P/TSX Composite High Dividend Index ETF | Vanguard FTSE Canadian High Dividend Yield Index ETF | Two different high-dividend indexes |
| Management fee / MER | 0.20% / 0.22% | 0.20% / 0.22% | No current fee advantage |
| Holdings | 75 at October 9 | 60 at August 31 | Count helps, but weights matter more |
| Top-ten weight | 45.64% | 68.65% calculated from issuer weights | VDY is more concentrated at the top |
| Largest holding | 5.37% at August 31 | 15.65% at August 31 | Single-company exposure differs sharply |
| 12-month trailing yield | 3.52% at October 9 | 3.11% at September 30 | Backward-looking, with different dates |
| Distributions | Monthly | Monthly | Frequency does not guarantee the amount |
| Inception | April 12, 2011 | November 2, 2012 | Both have more than a decade of history |
Figures come from the BlackRock XEI page, its August fund factsheet, and the Vanguard VDY page. VDY's top-ten figure is the sum of the ten weights Vanguard lists, rounded to two decimals.
What's tied: fee, currency and payment schedule
Both ETFs trade in Canadian dollars on the Toronto Stock Exchange. Both publish a 0.20% management fee, a 0.22% MER, and a monthly distribution schedule. A $10,000 position corresponds to about $22 a year at a 0.22% MER if the balance and ratio stayed unchanged. Fund expenses are deducted inside the ETF rather than billed separately to the investor.
So there is no lower-MER shortcut here. Commission, bid-ask spread, brokerage features and tax consequences can still differ for an individual trade, but the published MER does not separate XEI from VDY.
Currency is not the differentiator either. Each fund's mandate is Canadian equities, and Vanguard reported VDY at 100% Canada on August 31, 2026. The S&P index page reported XEI's underlying index at 100% Canada on June 30. Unlike a comparison between Canadian-listed and US-listed ETFs, US dividend withholding is not the central account-location issue.
Yield: 3.52% against 3.11%, and why it is not a forecast
BlackRock reported a 3.52% 12-month trailing yield for XEI at October 9, 2026. Vanguard reported 3.11% for VDY at September 30. These values use different dates and reflect distributions already paid relative to fund value. They are not guaranteed future income and do not measure total return.
A dividend moves value from the fund into cash; it does not create wealth on its own. Company earnings, share prices, dividend decisions, fund expenses and taxes determine the result, and a yield can rise simply because a holding's price fell, so it is no substitute for looking at the holdings.
Monthly frequency can suit an investor who wants regular cash flow, but the amount may change. Reinvesting distributions through a brokerage plan can reduce idle cash, though fractional-share support and plan rules vary. In a taxable account, reinvestment also creates new adjusted-cost-base entries. The site's ETF distribution and adjusted cost base guide explains that record-keeping chain.
Where the dividends are taxed, and where they aren't
Taxable account. Both funds mainly receive dividends from Canadian corporations, and CRA says individuals who report dividends from taxable Canadian corporations may be able to claim federal and provincial or territorial dividend tax credits. An ETF's cash payment can still contain eligible dividends, other income, capital gains or return of capital, so use the annual T3 slip and the issuer's tax breakdown rather than assuming every dollar is an eligible dividend.
Higher distributions can mean more current taxable income and less deferral than a lower-yield broad-market fund, which is not automatically tax-inefficient: province, income, available credits and losses, holding period and the eventual capital gain all matter. The eligible-dividend guide covers the mechanics without pretending there is one universal tax rate.
TFSA and RRSP. CRA says interest, dividends, and capital gains earned in a TFSA are generally tax-free, including on withdrawal, and that RRSP income is usually exempt while it stays in the plan, with withdrawals generally taxable. The dividend tax credit adds nothing inside either account, so XEI versus VDY there comes down to holdings, risk and the fund's role in the portfolio.
FHSA or RESP: eligibility is not a reason to take equity risk on a short deadline. A planned home purchase or education withdrawal can make time horizon and loss tolerance more important than the difference between two dividend indexes. Review the site's FHSA investment guide or RESP guide before comparing yield.
A dividend sleeve, not a whole portfolio
XEI and VDY deliberately emphasize higher-yielding Canadian companies. That means less exposure to companies that pay small dividends or none, and no built-in allocation to foreign equities or fixed income. A dividend strategy can be a chosen portfolio sleeve, but its cash distributions should not be confused with broad diversification.
Compare the dividend tilt with a broad Canadian index before deciding that either belongs at the core. The site's XIU vs XIC guide explains large-cap versus broad-market exposure, while VCN vs XIC compares two broader Canadian-market choices. For a direct cross-cluster comparison, the existing VDY vs VFV guide shows how Canadian dividends differ from US large-cap exposure.
Past performance should not decide it. Different sector and company weights lead at different times, and buying the recent winner can mean adding exposure after its biggest banks or energy holdings have already run up. If the two still look interchangeable after reviewing the holdings, simplicity has value: a second overlapping ETF is one more position to monitor and rebalance.
Related reading
- ETF account-location comparison hub
- VDY vs VFV: Canadian dividends or US large caps?
- Eligible dividends and the Canadian dividend tax credit
- ETF distributions and adjusted cost base
- VCN vs XIC: broad Canadian equity ETFs
Look up XEI or VDY
The screener shows an educational account-location read for each fund. Holdings, fees and distributions change, so confirm them with BlackRock and Vanguard.
Open XEI in the screenerFrequently asked questions
Why is VDY so concentrated in banks?
VDY tilts strongly toward Canada's largest high-yield companies. At August 31, 2026, Royal Bank was 15.65% and Toronto-Dominion Bank 11.07% of VDY, five of its ten largest holdings were major banks, and its ten largest positions added to 68.65%.
Which is more diversified, XEI or VDY?
By the August 31, 2026 issuer data, XEI held 75 securities and its ten largest positions were 45.64% of assets. VDY held 60 stocks and its ten listed largest positions added to 68.65%. Both remain concentrated in Canadian dividend-paying sectors.
Does XEI's higher yield mean better returns?
No. BlackRock reported a 3.52% 12-month trailing yield for XEI at October 9, 2026 and Vanguard 3.11% for VDY at September 30. Those figures use different dates, describe distributions already paid, and do not measure total return or guarantee future income.
Do XEI and VDY pay eligible dividends?
Mostly Canadian dividends, but not only. Both primarily hold Canadian dividend-paying companies, and eligible dividends passed through may support the dividend tax credit in a taxable account. Each payment can also include other income, capital gains or return of capital, so the T3 slip shows the actual character.
Sources
- BlackRock iShares Canada, XEI product page, objective, fees, holding count, yield, distribution frequency, and registered-plan eligibility; data through October 9, 2026, checked October 13, 2026.
- BlackRock iShares Canada, XEI fund factsheet, top holdings, concentration, fees, and portfolio characteristics at August 31, 2026; checked October 13, 2026.
- Vanguard Investments Canada, VDY product page, objective, fees, holding count, top holdings, yield, distributions, and TSX listing; varying dates through October 9, 2026, checked October 13, 2026.
- S&P Dow Jones Indices, S&P/TSX Composite High Dividend Index, index description, constituent count, country and sector data, and rebalancing schedule; data at June 30, 2026, checked October 13, 2026.
- S&P Dow Jones Indices, S&P/TSX Canadian Indices Methodology, XEI benchmark eligibility, selection, company cap, sector cap, and quarterly rebalancing; checked October 13, 2026.
- Cboe Canada ETF Market, XEI vs VDY comparison, independent cross-check of fees, benchmark, concentration, and sector differences; data at September 25, 2026, checked October 13, 2026.
- Canada Revenue Agency, Federal dividend tax credit, qualifying Canadian dividends, information slips, and reporting conditions; checked October 13, 2026.
- Canada Revenue Agency, Tax treatment of mutual funds, distribution tax character, information slips, reinvested distributions, and adjusted cost base; updated February 5, 2026, checked October 13, 2026.
- Canada Revenue Agency, What is a TFSA, general treatment of investment income and withdrawals; checked October 13, 2026.
- Canada Revenue Agency, Registered Retirement Savings Plan, general treatment of income within an RRSP and withdrawals; checked October 13, 2026.
- Canada Revenue Agency, Income Tax Folio S3-F10-C1, Qualified Investments, designated-exchange listings and ETF units as qualified investments for registered plans; checked October 13, 2026.