
XIU vs XIC: fees, holdings and account fit
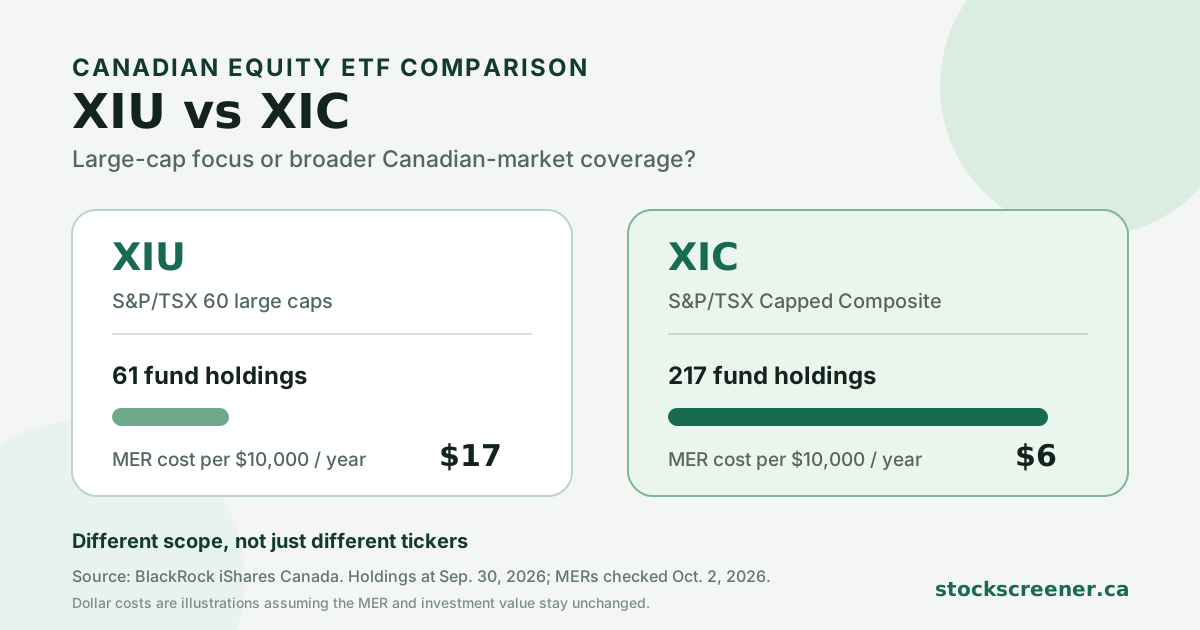
Answer first: XIC gives a Canadian investor broader market coverage at a lower current cost. It tracks the S&P/TSX Capped Composite Index and held 217 positions on September 30, 2026, while XIU targets the 60-company large-cap segment and held 61 positions. BlackRock reports a 0.06% management expense ratio, or MER, for XIC and 0.17% for XIU.
XIU is not simply a costlier version of XIC. It is a different tool: a concentrated, highly traded portfolio of established Canadian companies. That narrower mandate may appeal when large-cap exposure or trading liquidity is the explicit goal. For a long-term Canadian-equity core, however, XIC's broader index and lower MER are meaningful structural differences. A TFSA, RRSP, FHSA, RESP, or taxable account does not reverse them.
XIU versus XIC at a glance
Changing figures have explicit dates. Holdings and portfolio characteristics are at September 30, 2026. Net assets are at October 1, 2026. Issuer and official source pages were checked October 2, 2026.
| Factor | XIU | XIC | Practical read |
|---|---|---|---|
| Mandate | Canadian large caps | Broad Canadian market | XIC reaches farther down the market |
| Benchmark | S&P/TSX 60 Index | S&P/TSX Capped Composite Index | Different index scope |
| Management fee / MER | 0.15% / 0.17% | 0.05% / 0.06% | XIC has the lower published cost |
| Fund holdings | 61 at September 30 | 217 at September 30 | Fund counts can include cash or implementation positions |
| Net assets | $23.11 billion at October 1 | $34.74 billion at October 1 | Both are large, established funds |
| Inception | September 28, 1999 | February 16, 2001 | Both have long live histories |
| Trading / distributions | TSX in CAD / quarterly | TSX in CAD / quarterly | Same basic currency and payment schedule |
| Issuer eligibility flag | Registered plans: yes | Registered plans: yes | Eligibility is not the same as suitability |
The figures come from BlackRock's XIU and XIC product pages. The management fee pays the manager. MER is broader and reflects management fees, applicable operating expenses, and taxes for the reporting period.
What's in this guide
| Index coverage | Large-cap concentration versus broad-market reach |
| Fees and trading | The recurring fee gap and live execution |
| Overlap | What happens when both funds are held |
| Account location | TFSA, RRSP, FHSA, RESP, and taxable accounts |
| Switching | Tax and implementation consequences |
| Decision framework | A practical way to compare the two |
The real choice is large caps versus the broad Canadian market
BlackRock says XIU seeks to replicate the S&P/TSX 60 Index, net of expenses. S&P Dow Jones Indices describes that benchmark as the large-cap segment of the Canadian equity market, structured to reflect the sector weights of the broader S&P/TSX Composite.
XIC instead seeks to replicate the S&P/TSX Capped Composite Index. S&P's Canadian indices methodology overview identifies the Composite as the principal broad measure of Canadian equities and the S&P/TSX 60 as its large-cap segment. It also states that the Capped Composite limits a single constituent to 10% at rebalancing.
That structure makes XIC broader, but not globally diversified. Both funds remain Canadian-equity portfolios, and Canada's market has substantial exposure to financial, energy, and materials companies. XIC adds mid-sized and smaller Composite constituents, yet its returns will still be driven heavily by the same large banks, resource producers, railways, and other major companies found in XIU.
The fund counts need careful reading. XIU showed 61 holdings on September 30 even though its index has 60 constituents. An ETF page can count cash or another implementation position. It does not mean XIU quietly became a 61-stock benchmark. XIC's 217 positions on the same date show genuinely broader reach, but the smallest positions each have much less influence than the largest holdings.
XIC's lower MER is recurring; trading costs are immediate
BlackRock currently reports a 0.17% MER for XIU and 0.06% for XIC, a difference of 0.11 percentage points. Applied mechanically, the published MERs equal about $17 and $6 a year, respectively, for each $10,000 invested. The gap is about $11 per $10,000 annually if the value and rates remain unchanged. These costs are deducted inside each fund, not billed as a separate annual invoice.
The calculation is useful because the two funds come from the same provider and both use conventional index tracking. It does not predict their return difference. Different benchmarks can outperform in different periods, and a concentrated large-cap index may overcome a fee gap or lag the broader market. A past winner does not settle which index will lead next.
XIU can still have an execution advantage for some trades. BlackRock describes it as one of Canada's largest and most liquid ETFs. Liquidity matters to an investor who trades large amounts or needs a narrow live bid-ask spread. A long-term investor making a small purchase should still inspect the current quote rather than assuming either ticker always offers better execution.
Use a limit order when price control matters, and avoid relying on the previous close as a guaranteed price. Brokerage commissions, spreads, recurring-purchase support, fractional units, and dividend-reinvestment rules can matter more than a small fee difference for a short holding period or a small balance. Those features belong to the brokerage account, not the index.
Holding both mostly increases large-cap concentration
The S&P/TSX 60 is the large-cap segment within the Composite family. XIC therefore already owns the major companies that drive XIU. Combining the ETFs does not create two independent Canadian allocations. It mainly gives the 60 large-cap companies extra weight while preserving XIC's smaller positions around them.
That may be intentional. An investor could choose a broad-market core and add a measured large-cap tilt. It should be described honestly as a tilt, not extra diversification. Two ticker symbols do not necessarily mean two distinct sources of risk.
The issue also appears inside all-in-one ETFs. A global asset-allocation fund may already hold XIC or another broad Canadian equity ETF. Adding XIU beside it can raise Canadian and large-cap exposure without being obvious from the number of fund names. Read through to underlying holdings before concluding that the portfolio became more diversified.
XIU vs XIC in a TFSA, RRSP, FHSA, RESP, or taxable account
TFSA: CRA says interest, dividends, and capital gains earned in a TFSA are generally tax-free, including on withdrawal. That shelter does not favour XIU over XIC. The decision remains index breadth, concentration, fees, risk, and the role of Canadian equities in the full portfolio. CRA also states that investment losses do not increase TFSA contribution room.
RRSP: CRA says investment income is usually exempt from tax while it remains in an RRSP, and withdrawals are generally taxable. Both ETFs are Canadian-listed wrappers holding mainly Canadian shares, so this is not the US-listed versus Canadian-listed withholding-tax choice discussed in the site's Canadian-listed versus US-listed ETF guide. The RRSP label creates no special XIU advantage.
FHSA and RESP: both are equity funds that can lose value. A home purchase or education expense may arrive on a fixed schedule, so the amount allocated to equities can matter more than choosing between 60 and 217 fund positions. The FHSA investment guide and RESP account-location guide explain how a shortening withdrawal horizon can change the risk decision.
Taxable account: neither ticker receives a unique account-location edge. CRA says mutual fund trust distributions can include dividends, capital gains, foreign income, other income, and return of capital. Return of capital reduces adjusted cost base, while reinvested taxable distributions can increase it. Use the T3 slip and BlackRock's annual tax information instead of treating every quarterly payment as a simple eligible dividend. The site's ETF distribution and adjusted cost base guide explains the record keeping.
CRA says dividends from taxable Canadian corporations may support a federal dividend tax credit when the reporting conditions are met. Capital gains on a sale can also receive different treatment from ordinary income. Those are reasons Canadian equity may have a role in taxable-account planning, but they do not establish a universal XIU-versus-XIC winner. Province, income, loss carryforwards, and the rest of the household portfolio can change the result.
A lower MER does not automatically justify switching
An existing XIU holder can recognize XIC's lower cost without treating a switch as mandatory. Selling can create a bid-ask spread, commission, time out of the market, and a realized capital gain or loss in a taxable account. Compare those one-time costs with the recurring fee difference and the desired exposure.
A taxable capital gain can create tax sooner than continuing to hold. A loss needs its own review. Buying XIC after selling XIU is not something this article can declare safe from Canada's superficial-loss rule. CRA's archived interpretation bulletin says whether properties are identical is a question of fact based on their material qualities. The bulletin is not law and is no longer updated. The site's superficial-loss guide covers the 61-day testing window and explains when professional tax advice may be useful.
Inside a registered account, the immediate tax realization issue usually falls away, but transaction costs and allocation still matter. If the intended exposure truly changed from large caps to the broad market, a switch has a portfolio rationale. If the only motivation is whichever ticker recently performed better, the rationale is weaker.
A practical XIU vs XIC decision framework
- Name the intended exposure. Choose between a deliberate large-cap sleeve and a broader Canadian-market sleeve before comparing tickers.
- Measure existing overlap. Look through all-in-one funds and other Canadian ETFs already in the portfolio.
- Compare recurring and one-time costs. Use the current MERs, live spread, commission, and any tax from switching.
- Match risk to the timeline. Both are equity funds. Neither makes near-term spending needs safe.
- Check implementation details. Brokerage automation and order execution can break a close tie, especially for regular small purchases.
- Recheck the documents. Fees, holdings, distributions, and brokerage features can change after October 2, 2026.
The sibling VCN vs XIC comparison examines two broad Canadian-market methodologies, while XIC vs ZCN compares two wrappers tracking the same index. The broader ETF account-location comparison hub shows when currency, listing, and foreign withholding create larger account differences. In XIU versus XIC, benchmark scope and cost do the real work.
Related reading
- ETF account-location comparison hub
- VCN vs XIC: fees, indexes and account fit
- XIC vs ZCN: same index, fees and account fit
- Eligible dividends and the Canadian dividend tax credit
- Canadian stock and ETF account-location framework
Check each ticker in context
Use the free screener for an educational account-location overview, then verify the latest holdings and documents with BlackRock.
Open XIU in the screenerFrequently asked questions
What is the main difference between XIU and XIC?
XIU tracks the 60-company large-cap segment of the Canadian market. XIC tracks the much broader S&P/TSX Capped Composite Index and currently holds more securities at a lower published MER.
Is XIU or XIC cheaper?
XIC is cheaper on the current published figures. BlackRock reports a 0.06% MER for XIC and 0.17% for XIU. Applied mechanically, that is about $6 versus $17 a year per $10,000 invested if the rates stay unchanged.
Is XIU or XIC better for a TFSA or RRSP?
The account type does not create a special advantage for either fund. Both are Canadian-listed ETFs holding mainly Canadian shares. Index coverage, concentration, cost, time horizon, and the complete portfolio are more useful decision factors.
Does holding XIU and XIC add diversification?
Not relative to XIC alone. The S&P/TSX 60 is the large-cap segment within the broader Composite index family, so XIC already includes the major companies that drive XIU. Combining them mainly increases the weight of those large companies.
Sources
- BlackRock iShares Canada, XIU product page, objective, benchmark, fees, assets, holdings count, listing, registered-plan flag, and distribution schedule; holdings at September 30, 2026, net assets at October 1, 2026, checked October 2, 2026.
- BlackRock iShares Canada, XIC product page, objective, benchmark, fees, assets, holdings count, listing, registered-plan flag, and distribution schedule; holdings at September 30, 2026, net assets at October 1, 2026, checked October 2, 2026.
- S&P Dow Jones Indices, S&P/TSX 60, index objective and large-cap market scope; checked October 2, 2026.
- S&P Dow Jones Indices, S&P/TSX Canadian Indices Methodology overview, Composite family structure and Capped Composite's 10% constituent cap; checked October 2, 2026.
- Canada Revenue Agency, What is a TFSA, general tax treatment and ETF investing; updated September 17, 2026, checked October 2, 2026.
- Canada Revenue Agency, Before you contribute to a TFSA, the effect of investment gains and losses on contribution room; updated February 20, 2026, checked October 2, 2026.
- Canada Revenue Agency, Making withdrawals from an RRSP, tax treatment while funds remain in the plan and on withdrawal; updated January 29, 2026, checked October 2, 2026.
- Canada Revenue Agency, Tax treatment of mutual funds, distribution types, return of capital, reinvested distributions, adjusted cost base, and dispositions; checked October 2, 2026.
- Canada Revenue Agency, Federal dividend tax credit, qualifying Canadian dividends and tax-slip reporting; updated August 14, 2026, checked October 2, 2026.
- Canada Revenue Agency, IT-387R2, Meaning of Identical Properties (archived), the fact-specific interpretive approach to identical property; checked October 2, 2026.
- Cboe ETF Market Canada, XIC vs XIU comparison, independent cross-check of benchmark, fees, holdings concentration, and fund characteristics; data at September 11, 2026, checked October 2, 2026.